Step 1:Write a Query to Monitor Multiple Sources
- Identify the log sources you want to monitor.
- Create a Splunk search query that checks for events from those sources within a specific timeframe.
- Example query:
Query without additional fields
| makeresults
| eval source=split("source1,source2,source3", ",")
| mvexpand source
| join type=left source [ search index=<your_index> earliest=-1h | stats count by source ]
| fillnull value=0 count
| where count = 0
Query with additional fields “message”
| makeresults
| eval message="log source not send data"
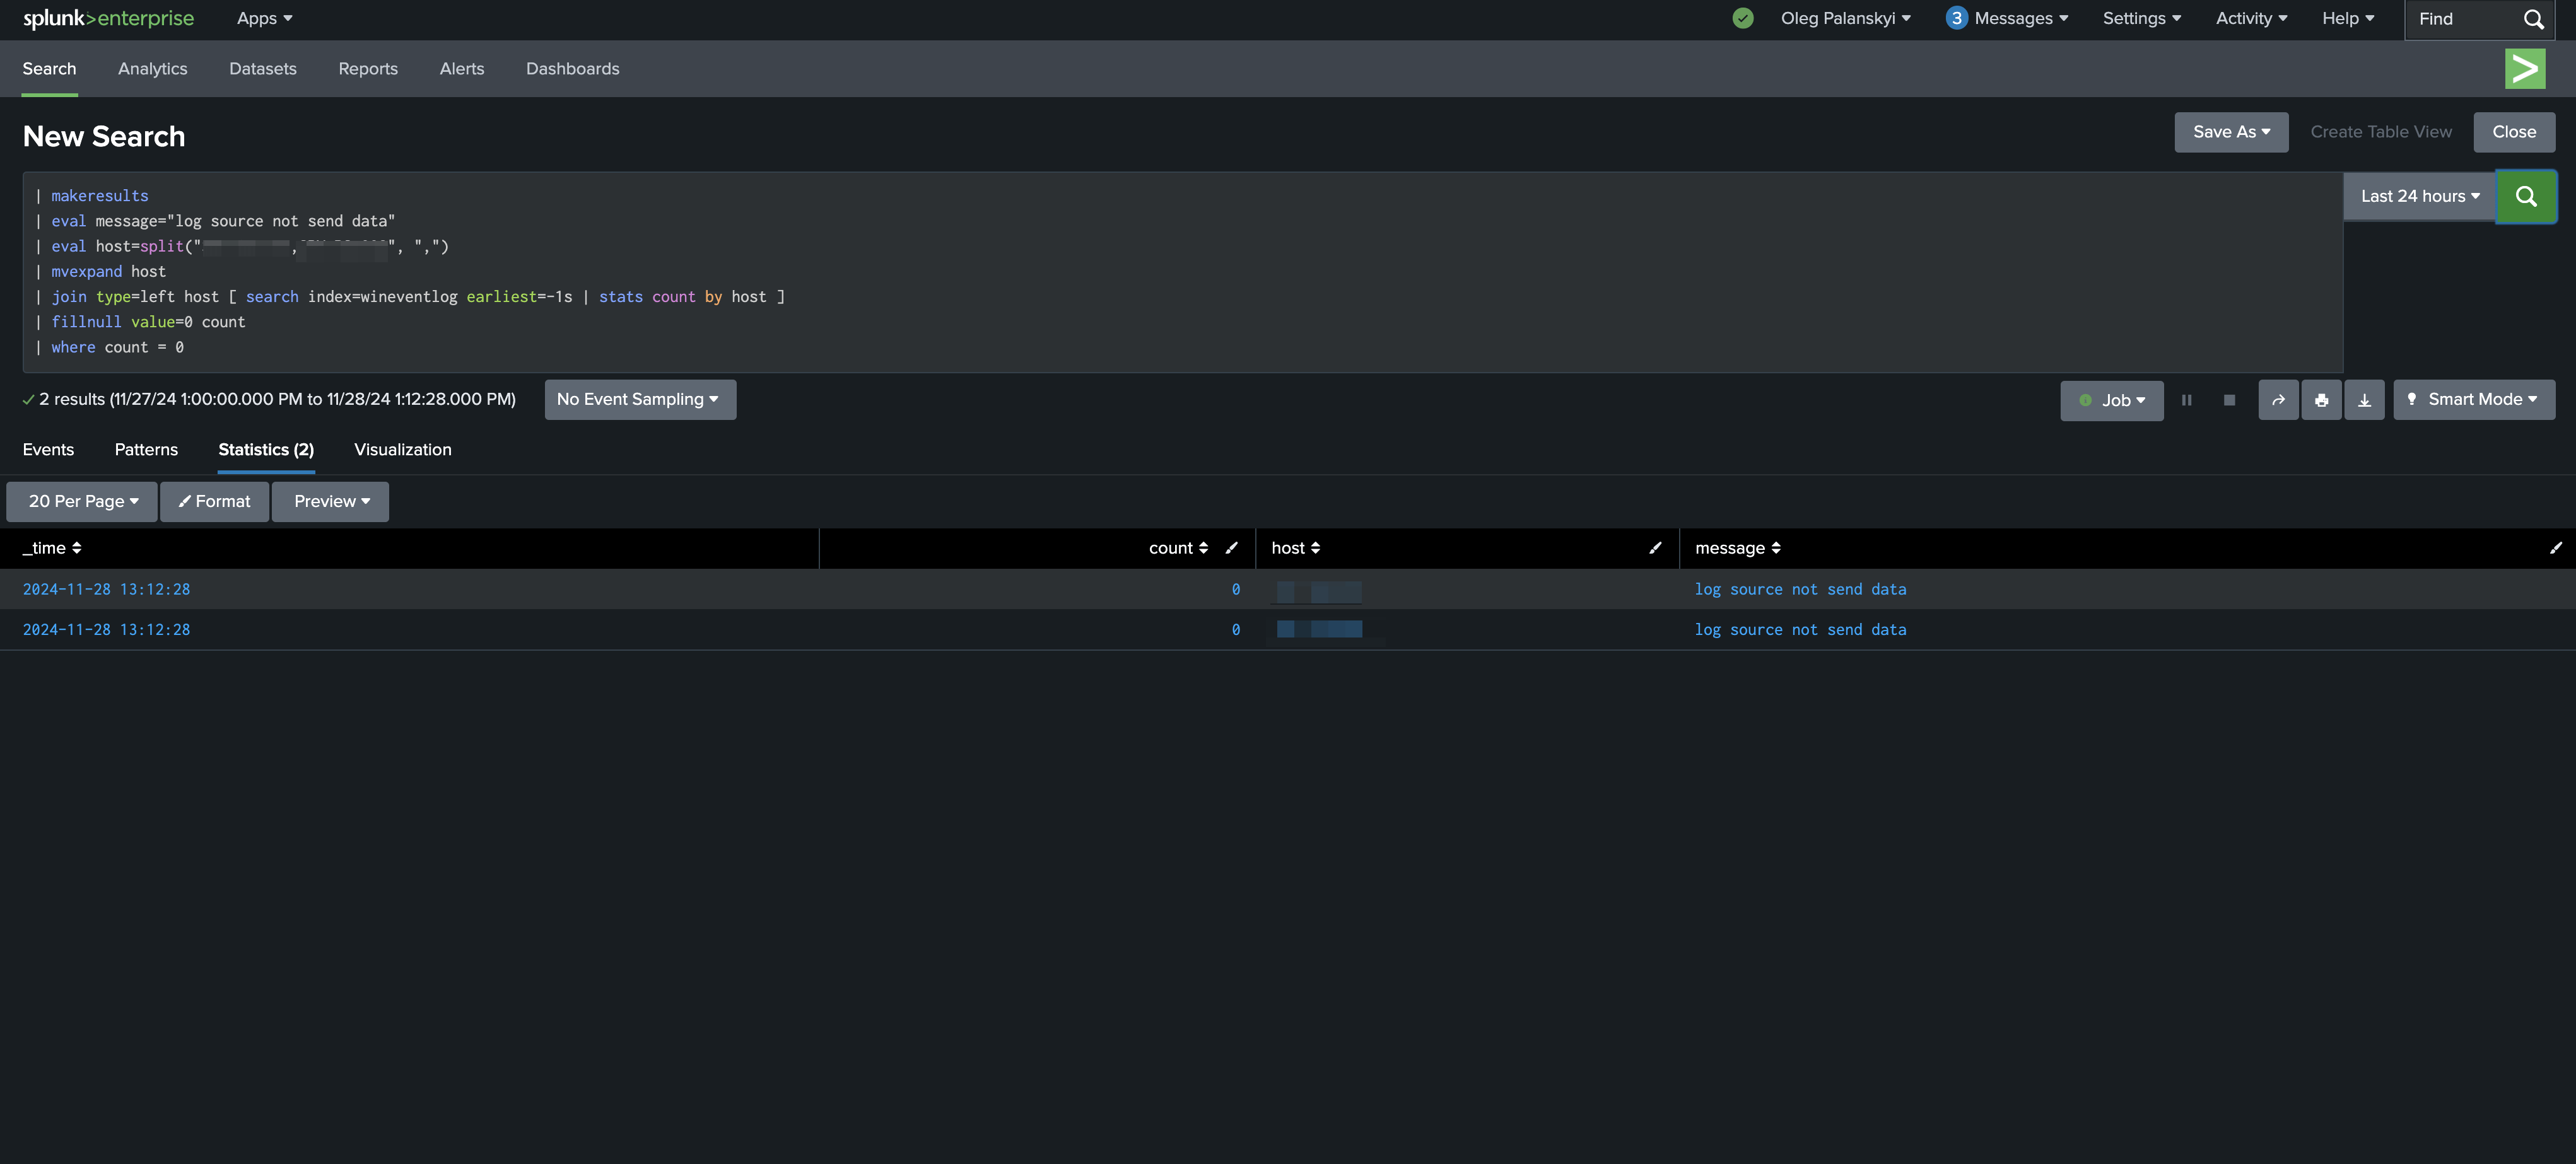
| eval host=split("XXX-XX-XXX,XXX-XX-XXX", ",")
| mvexpand host
| join type=left host [ search index=wineventlog earliest=-1h | stats count by host ]
| fillnull value=0 count
| where count = 0- earliest=-1h: Searches for events in the last 1 hour.
For example, on the screenshot, I set two hosts to monitor and earliest -1s for testing.
Now, if they stop coming, you will see results like on the screenshot.

Step 2: Create an Alert
- In Splunk:
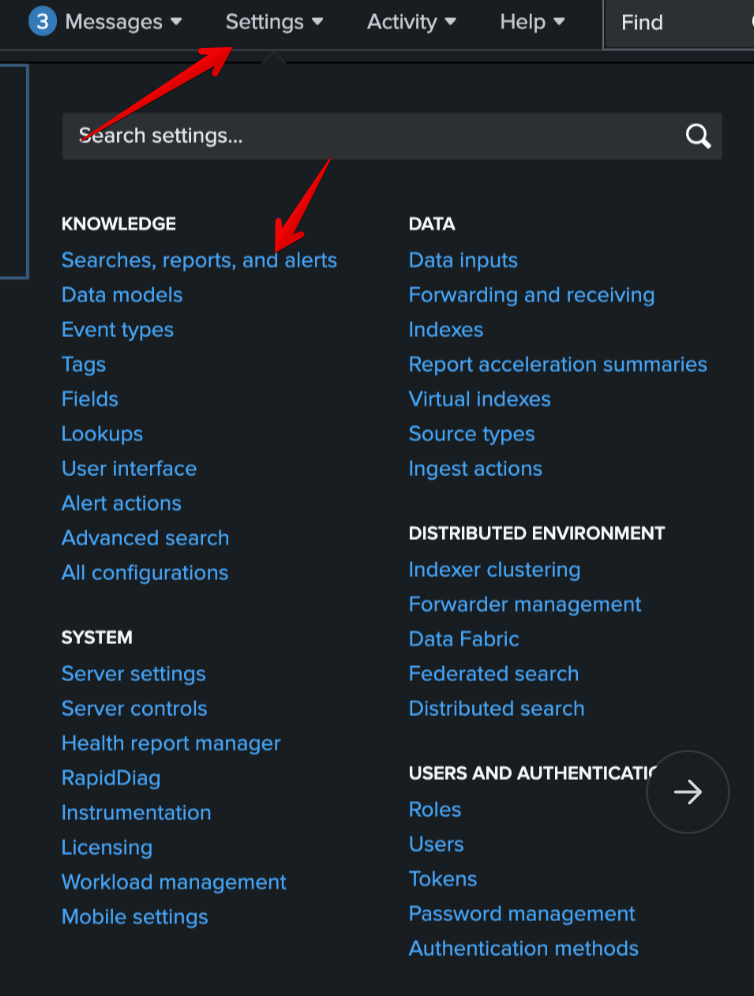
- Go to Settings > Searches, reports, and alerts.
- Click New Alert.
- Configure the New Alert:
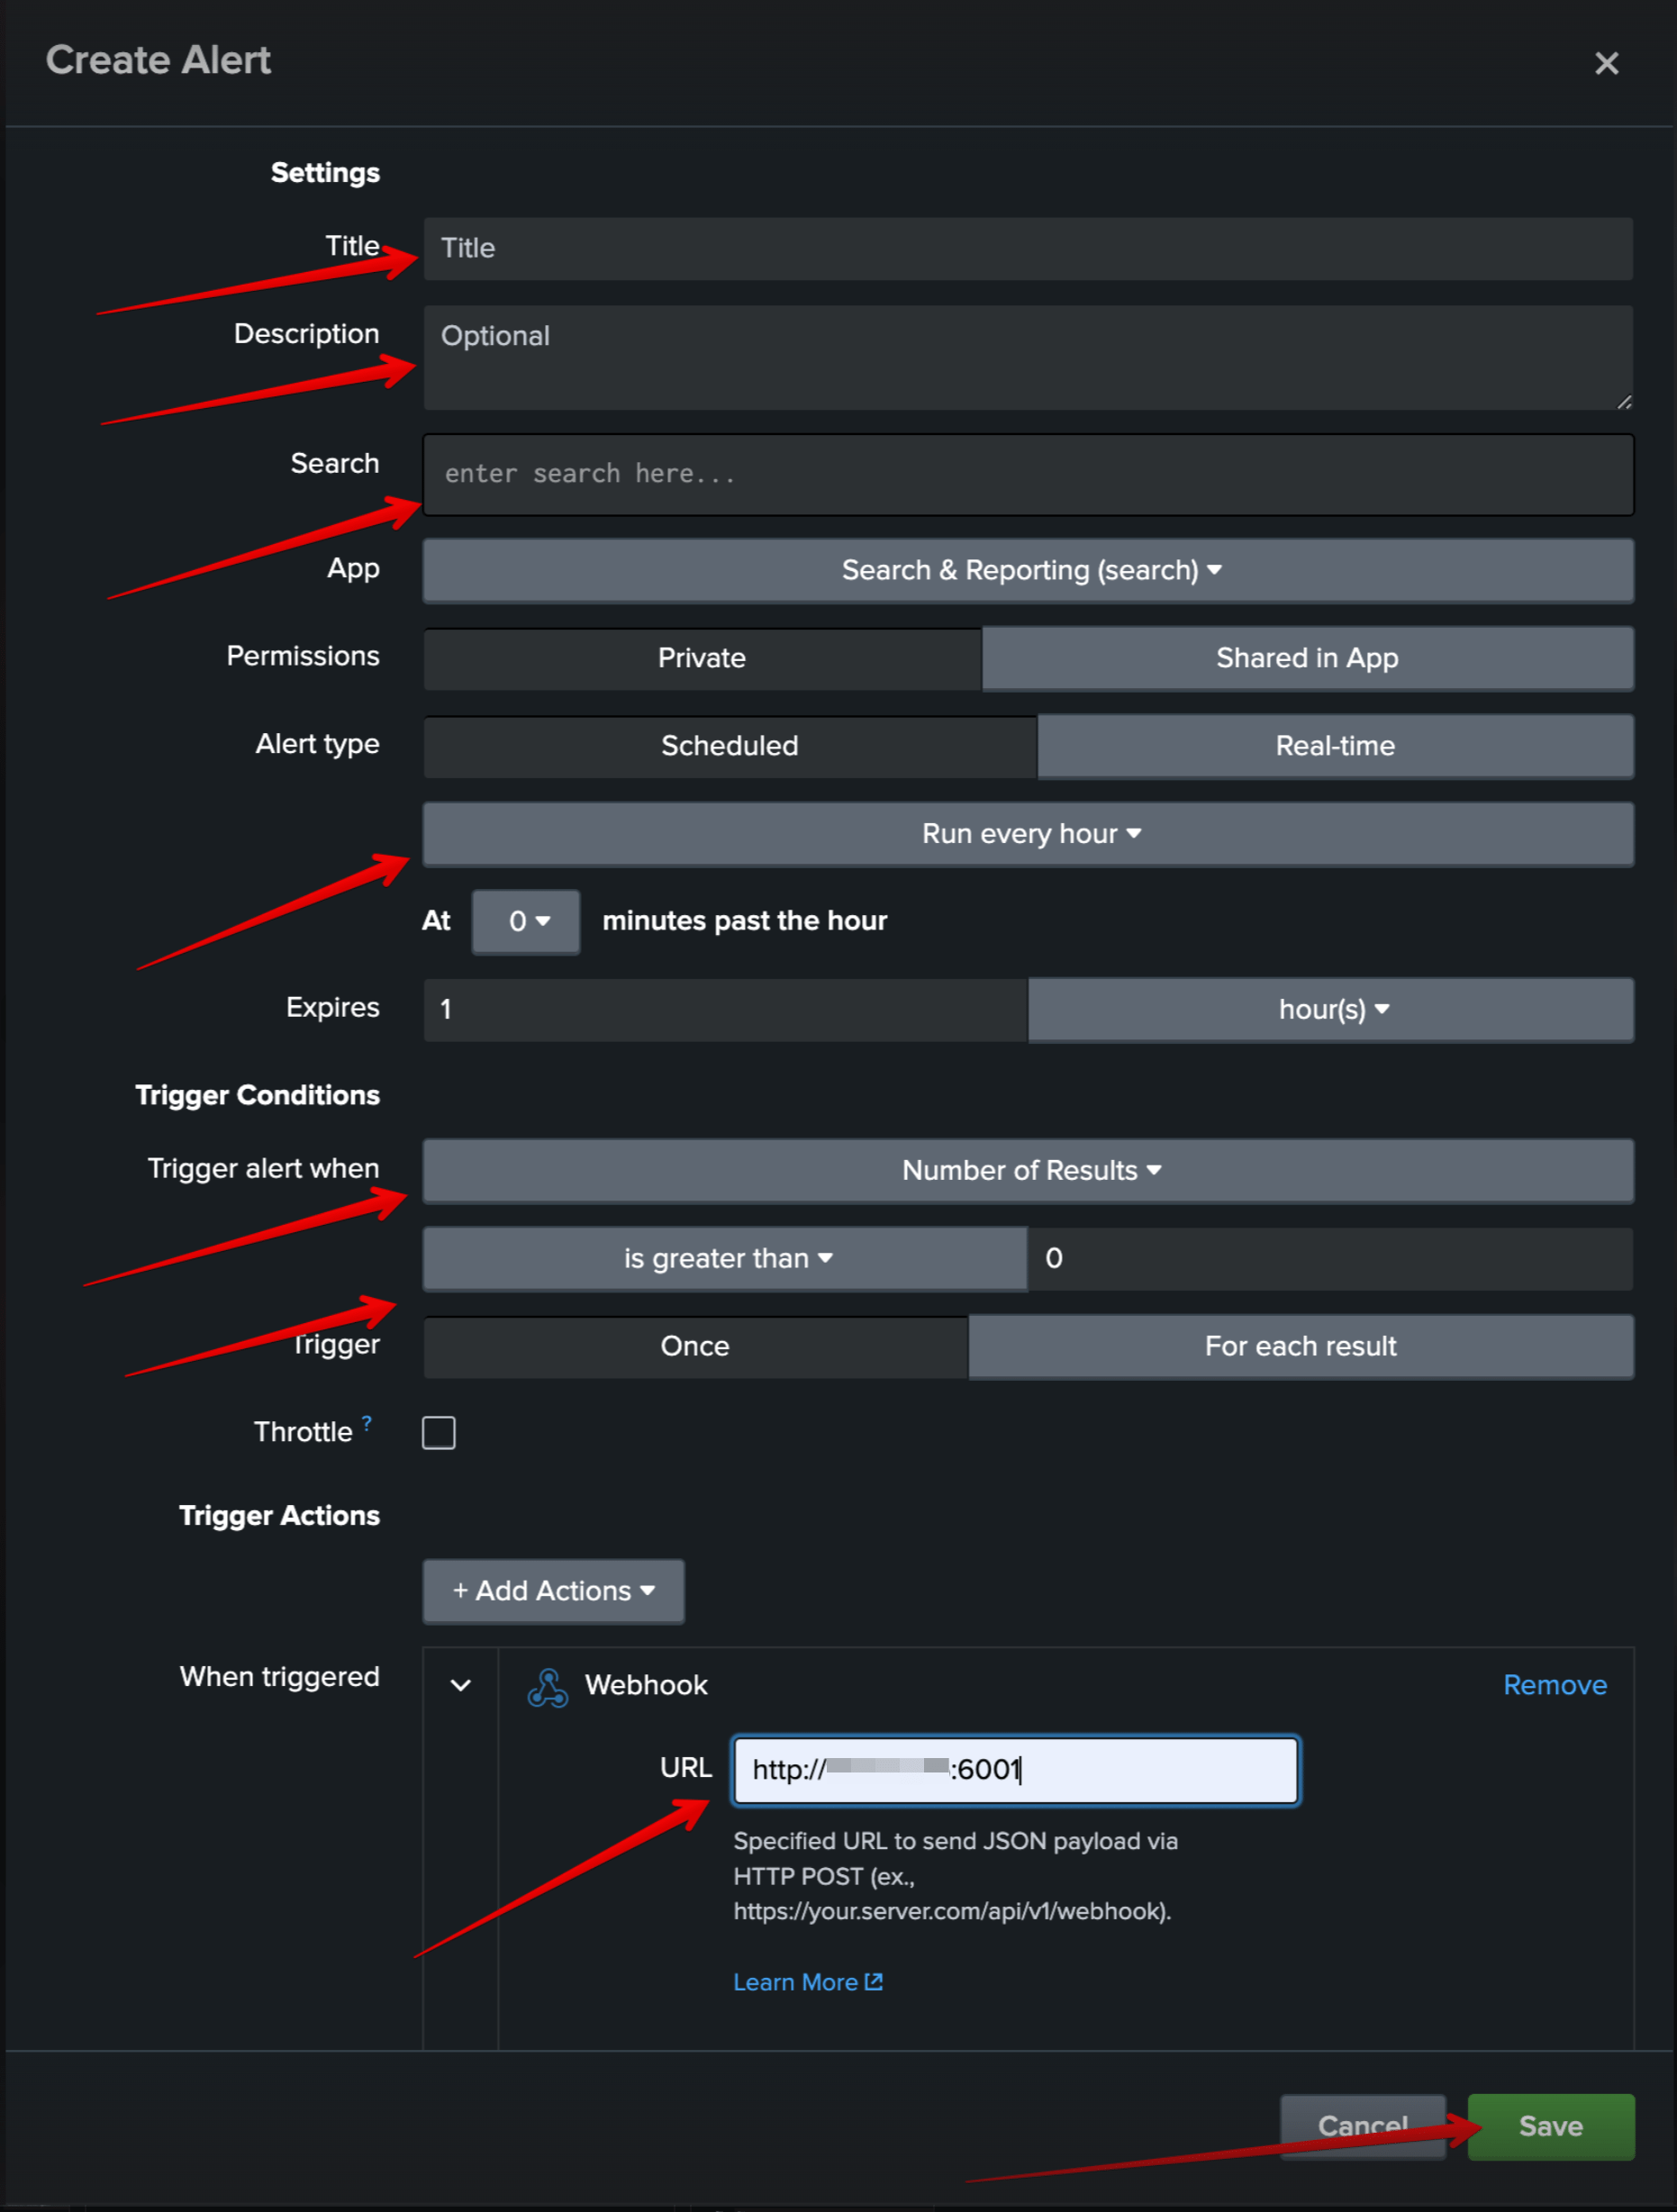
- Title the alert (e.g., Multiple Source Monitor).
- Description (Optional)
- Search (your write query in step 1)
- Set the alert to run on a schedule (e.g., every 5 minutes or hourly).
- Trigger when the number of results (sources with zero logs) is greater than 0.
- Set action when triggered (For example, webhook)
- Save alert
Finally, you will see your alert, and when it’s triggered, you will see it
For example, on the screenshot, I set sending to http port
For example, on the screenshot, I set sending to http port


The post Splunk: How to Write a Query to Monitor Multiple Sources and Send Alert if they Stop Coming appeared first on SOC Prime.


