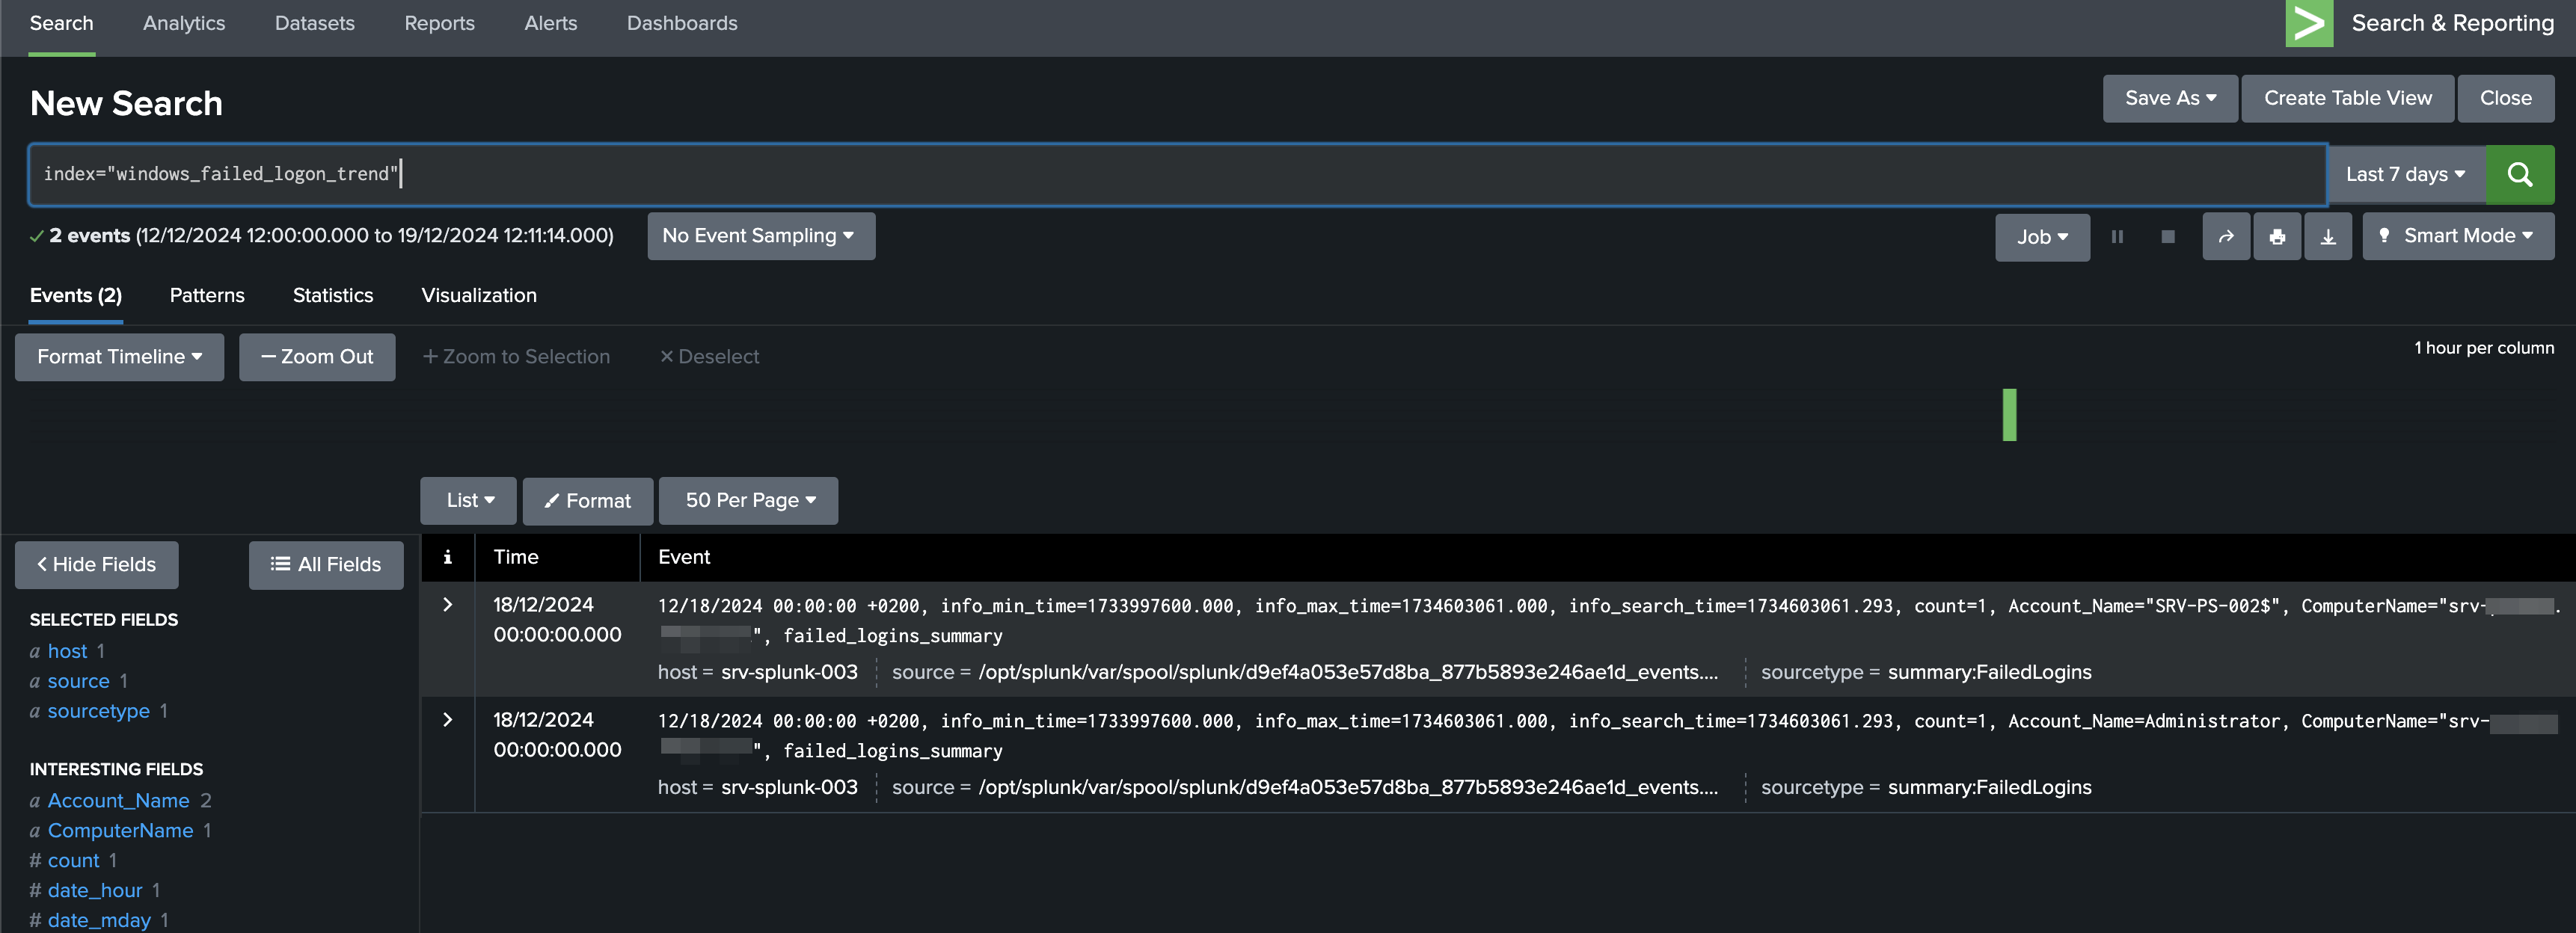
In some scenarios, you may need to save the results of a search into another index—for example, to reuse the data for correlation or trend analysis. The collect command in Splunk allows you to write search results into a summary index for long-term storage or faster analysis.
Example: Aggregate Failed Login Attempts
Suppose you want to aggregate failed login attempts and store a weekly summary of these events for trend analysis. You can configure a Splunk alert without any action, simply to save the results of failed login counts per user per day.
The first part of the search aggregates the necessary data:

This search generates a table summarizing the failed login attempts by user (Account_Name), computer (ComputerName), and date (_time).
You can save this summarized data into a new summary index named windows_failed_logon_trend using the collect command:
index=windows EventCode=4625
| bin span=1d _time
| stats count by _time, Account_Name, ComputerName
| collect index=windows_failed_logon_trend sourcetype="summary:FailedLogins" marker="failed_logins_summary"
Outcome:

The summarized results will be written into the windows_failed_logon_trend summary index. This index can then be used for investigation or further analysis.
Benefits
Save Search Resources: Instead of querying source logs every time, you can retrieve data from the summary index, which is faster and more efficient.
Reuse Data: The stored summary events can be used for creating trends, dashboards, or additional correlations without reprocessing the original logs.
By using the collect command, you can efficiently manage and reuse data, optimizing your Splunk environment for performance and usability.
The post Splunk: Using collect Command for Creating New Events in a New Index appeared first on SOC Prime.
